police
RACER
MODULE 1
MODULE 2
MODULE 3
INSTRUCTIONS
GAME DATA
HANDOUTS

Collecting, Organizing and Drawing Conclusions from Data

Contributors: Shonda Kuiper, DASIL, Shreyas Agrawal '24, Ginger Rowell, Rod Sturdivant


Part 2A: Introduction

Much like the behind-the-scenes experts on Top Gear who run data-gathering tests to spin into easy-to-digest soundbites for everyday audience members, you now have the start of the information you need to put together some statistics based on the Racer game.

In this lab, your goal is to complete a research study based on the Racer game. Just like last time, each car can be raced multiple times on a track and the time to complete each race will be recorded. This time, however, there are three drivers (just think of them as our rather roguish Top Gear hosts!) – Classic, Cruiser, and HotRod. After you race the cars, you can analyze the data in the table.


Part 2B: Designing an Experiment

Many people assume that statistics focuses on calculations. Have you spent time in Las Vegas, Atlantic City, or even just a plain old casino? It’s easy to think that betting on something like, say, the World Cup or Super Bowl comes down to a bunch of math problems pitted against each other – when in reality, there are a lot of other variables that figure in when calculating those odds. Most real-world statisticians spend much more time properly collecting data (or cleaning/organizing data) than they do on the calculations. For example, before collecting any data for an experiment involving the Racer game, a researcher should look at all of the steps below:

Develop a hypothesis about the population of all races. Here are a few examples:

  1. I believe that on average, the Classic car is faster than the HotRod Car.
  2. I believe that on average, the HotRod car will complete a race faster than the Cruiser car.
  3. I believe that at least one of the average Finish Times is different for the Classic, Cruiser, or HotRod cars.

Determine how you will collect your sample

  1. What will you consider as an observation? For example, will it be a player, an individual race, a pair of races, a car, or a track?
  2. How many samples will you collect?
  3. What is the explanatory variable? Is it categorical or quantitative?
  4. What is the response variable? Is it categorical or quantitative?
  5. How will randomization be incorporated into the data collection?
  6. What specific data needs to be recorded with each race?
  7. What graphs or statistical methods do you plan to use once you collect the data?

In the example below, we discuss using a paired t-test.


Identify potential confounding variables.

Once again, it’s key to take into account possible confounding variables (variables that the researcher did not include in the study but that might be connected to both the independent variable and the dependent variable), to determine if the car speeds are in fact truly different. Here’s an example: some racetracks are longer than others. We want to hold the track constant for everyone in your experiment to ensure that the type of track does not bias our results. Are there any other potential confounding variables that might get in the way of determining which car is faster?


Part 2C: Collecting Data

Unlike the cavalier folks in Top Gear, who thumb their noses at the rules, researchers need clear protocols (instructions) so that the experimental data is collected using the same process every time. Documentation of these protocols also enables other researchers to verify the validity of the data. If collecting data as a class, clearly identify the exact protocols and timeframe for collecting data. For example, here are the protocols for data collected in an earlier class:

  1. All data was collected during class time on a computer in the statistics lab room.
  2. Students logged onto the site and went to the Racer game.
  3. Make sure you enter the correct GroupID and PlayerID.
  4. Click on the Paired Test button on the main menu after logged in.
  5. Each student in the class will race exactly two times on the Oval Track. Prior to racing the cars, students were randomly assigned which car they would race first.
  6. Click on the left box to select the car you will race first.
  7. Then select the car you will race second.
  8. Then select the SELECT TRACK button.
  9. Then click the START button.
  10. Use the arrow keys to race the car.

Figure 1: Enter your PlayerID and GroupID

Enter your PlayerID and GroupID

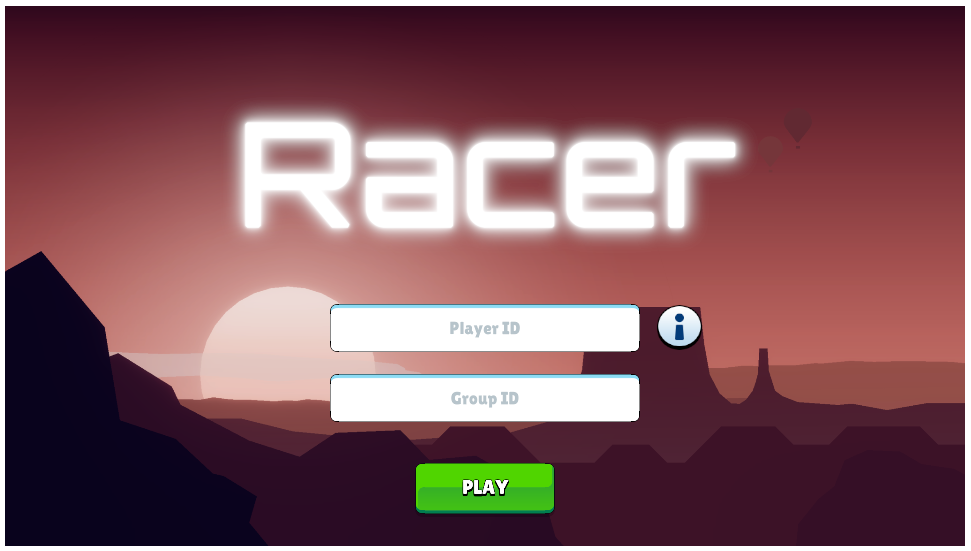
Figure 2: Select your car and customize it

Select your car and customize it

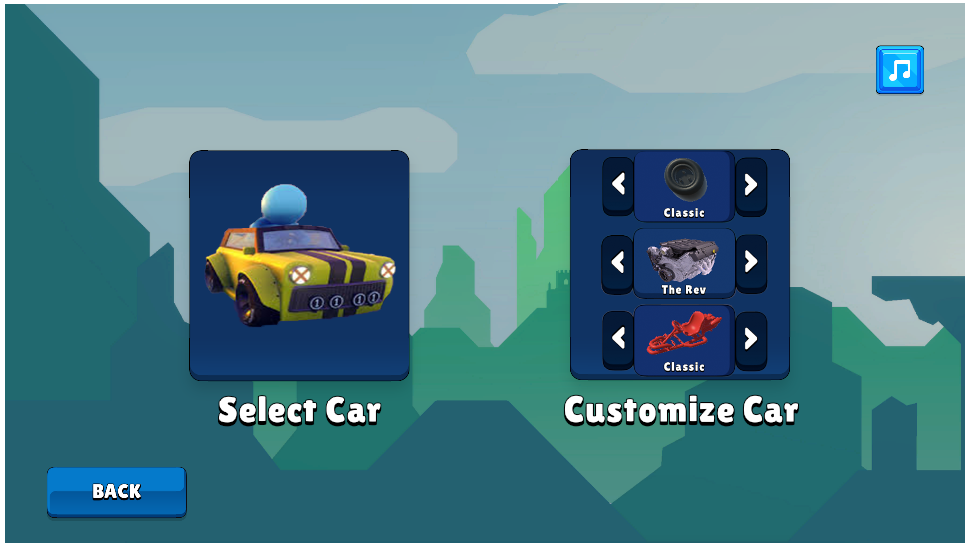
Figure 3: Choose the track

Choose the track

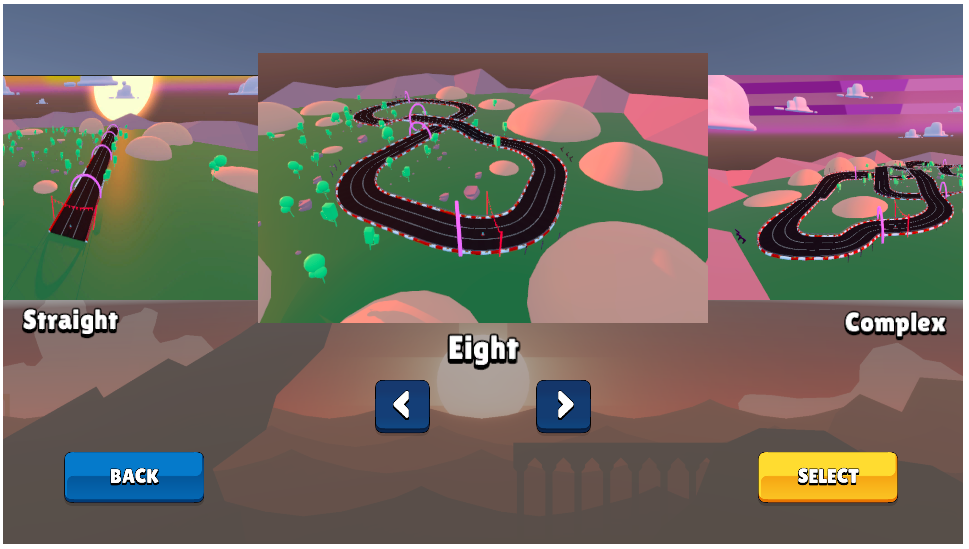
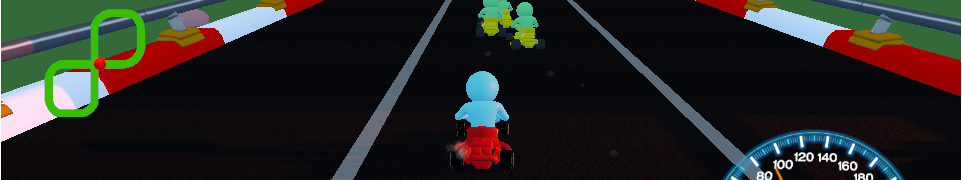
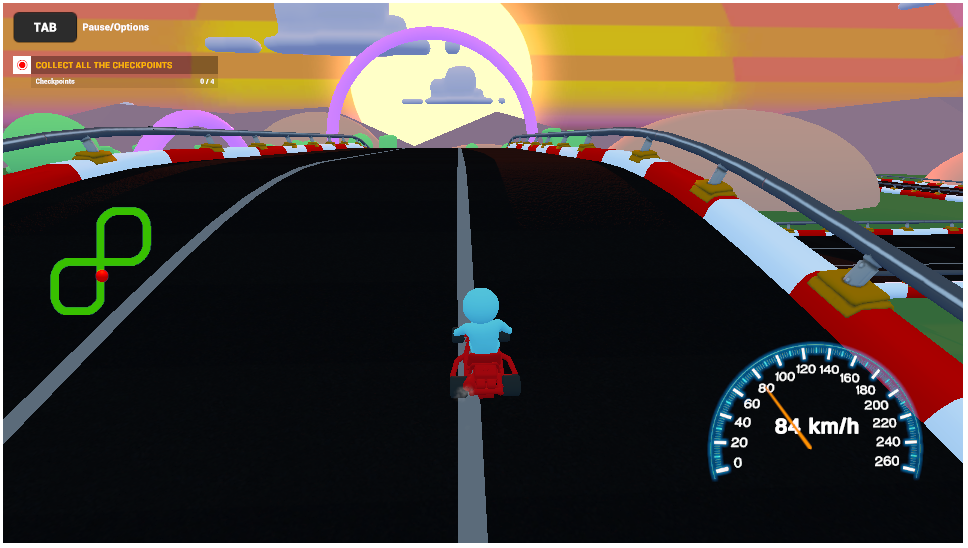
Figure 4: Race on your vehicle!

settings to generate data
Part 2D: Examining the Data

Before you start any calculations, it is essential to examine your data. Ask yourself the following questions for the data collected in the Racer game:

    1. Were there any players who did not properly follow protocols? Did they play the game an incorrect number of times? Did they use the wrong cars or tracks? Can their data be included?

    2. Were there any outliers or skewed data? How does this influence our analysis? Should these outliers be removed?

    3. Some people have a natural talent for video games; to others, it’s a completely foreign concept. How can we account for player skill level?

    4. How do we account for the influence of order in which cars are raced? For example, would you expect players to perform better after practicing with the first car?

    5. How does the variation in effect size (the difference between means) compare to the random variation in our data?

    6. Are there any other issues that may cause our data to be unreliable or invalid?

    7. What conditions are required to conduct a statistical analysis? How can you evaluate whether these conditions were met? If the sample size is small, it is particularly important to verify that the conditions are satisfied. What should you do if the needed conditions are not met?


    Watch the following video to see an example of how data cleaning can influence a statistical analysis.


Part 2E: Analyzing Data

Before we analyze the data your class has collected, let’s look at a sample dataset, called sample2. Get started by completing the questions below to make sure you understand how this app works, then analyze your class data.

To use the app, start with the following settings then answer the questions below.


Settings A

  • Group ID   sample2
  • Track:   OvalTrack
  • X-axis Variable:   Body
  • Y-axis Variable:   Finished Time
  • Color by:   Body
  • Check:   Show Summary Statistics


  • Instructors Note: Go to faculty resources to access student data


    Continue to Part 3


    Data Stories


    NYPD
    Covid-19
    Recidivism
    Brexit

    Stats Games


    Racer
    Greenhouse
    Statistically Grounded
    Psychic

    Questions?


    If you have any questions or comments, please email us at DASIL@grinnell.edu

    Dataspace is supported by the Grinnell College Innovation Fund and was developed by Grinnell College faculty and students. Copyright © 2021. All rights reserved

    This page was last updated on  November 11th  2024.