coffe truck
STATISTICALLY GROUNDED
MODULE 1
INSTRUCTIONS
GAME DATA
HANDOUTS


Using statistics to succeed in coffee business

Contributors: Shonda Kuiper


Fun Fact:fun fact icon

In business, expenses are often categorized as either "fixed" or "variable," much like a regression equation—think y = a + bx, where ‘a‘ represents the fixed expenses ($300), ‘b‘ is the cost of each sale ($0.50), and 'x' stands for the number of cups sold.
Part 1A: Introduction

Let’s assume that you and your best friend, Jo, live in the bustling city of Beanville. Jo's love for coffee is contagious, and you two share a dream of starting your own coffee business.

For example, to make a profit, farmers need to decide if they should purchase and apply fertilizer or install an irrigation system. They also need to consider the long-term effects on the environment. A farmer’s challenges do not end with the harvest: changing market conditions may mean that the farmer cannot recover the season’s costs, resulting in a financial loss.

With a passion for all things caffeinated, Jo has started brewing up a strategy to purchase a coffee truck and serve her delightful concoction to customers throughout the city. While you don’t want to waste any time getting started with this entrepreneurial adventure, you are hesitant to make any major purchases before developing a careful business strategy. After meticulously researching how to kickstart a small business, you have the following expenses: $300 fixed expenses for rent and $0.50 variable expenses for each cup of coffee. There are multiple factors that can affect coffee sales and profit:

  • Location: The accessibility and proximity of a coffee shop to potential customers can greatly influence sales, as convenient locations attract more foot traffic.
  • Music: The ambiance created by the type of music played in a coffee shop can influence customers' moods and perceptions, impacting their likelihood to stay longer and make additional purchases.
  • Price: The price of coffee products can directly affect sales, as customers evaluate the perceived value and affordability of the offerings before making a purchase decision.
  • Time: The time of day, such as peak hours or slow periods, can affect coffee sales, as customer demand and preferences vary throughout the day, requiring appropriate staffing levels and tailored marketing strategies.


  • Figure 1: Settings to start Greenhouse Game for Part 1

    settings to start game

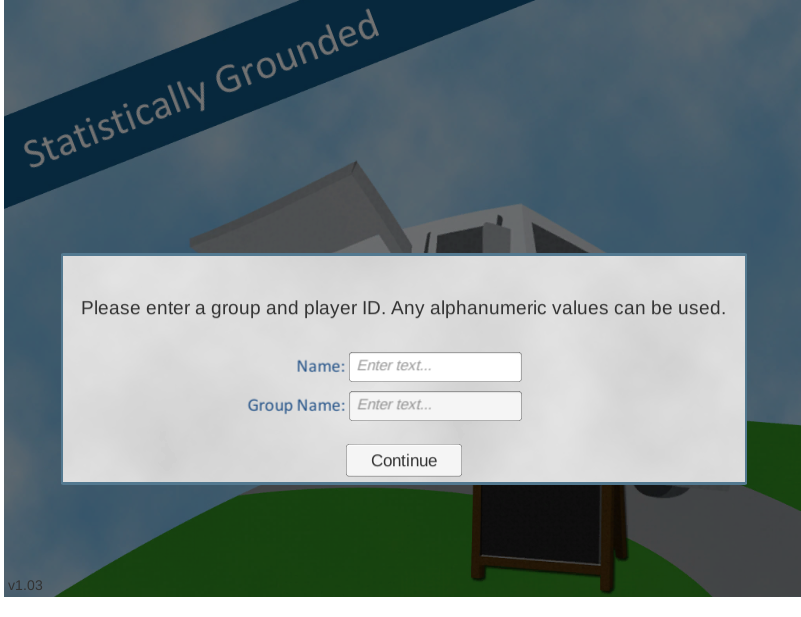
    Figure 2: Settings to generate data for Part 1

    settings to generate data

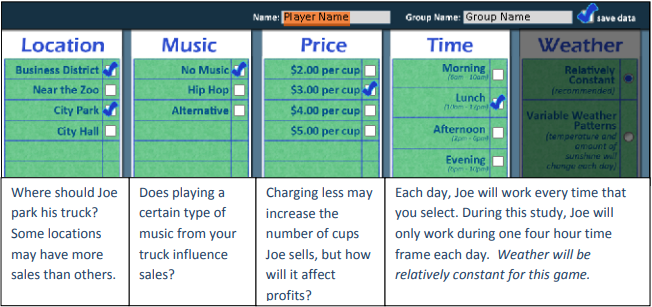
    Figure 3: Settings to generate data for Part 1

    settings to generate data

    Figure 4: Settings to generate data for Part 1

    settings to generate data

    Figure 5: Settings to generate data for Part 1

    settings to generate data
    Part 1B: Learning the Statisically Grounded game

    The Coffee Truck Game can also be an opportunity to consider a variety of research questions, such as what combination of conditions would optimize the sales or profits? Most real-world research questions are much bigger than the resources available to study them, and researchers must limit the scope of their efforts. Similarly, we will start with a simplified question. We will conduct a test to test whether there is a difference in sales between two different locations.

    The game can be played below to collect data:

  • Provide a Player ID (see Figure 1). All name will work, but this name will be on the internet, so do not use a name that will easily identify you.
  • Provide a Group ID. If you are playing this game for a course, use the exact Group ID provided by your instructor, which is the same for every person in the class.
  • Under location (see Figure 2), select Business District and City Park.
  • Under Music, select No Music.
  • Under Price, select $3 dollars per cup.
  • Under Time of Day, select Lunch
  • Under the Design Type (See Figure 3), select Random Sample.
  • Under Number of Repetitions, enter 10.
  • Select Start Sim.
  • Then on the next page (See Figure 4), select Get All Sales Data and Continue
  • Click on the Game Data button (See Figure 5) to get all data
  • For this activity Random Sample means that both locations (Business District and City Park) are used the same number of times and that locations will be selected in random order. In this study, both locations will be tested 10 times, totaling 20 days for the study.


    NOTE: If you are unable to play the game, either try a different browser or go to the game website directly here.

    Part 1C: Exploring Example Data

    Before we analyze the data your class has collected, we will look at an example dataset from someone that already completed this activity. To begin, set Coffee Truck App1 to Settings A (at left) and then answer the questions below.


    Settings A

  • Group ID   sample1
  • Player ID   player1
  • X-axis Variable:   Location
  • Y-axis Variable:   Sales
  • Color by:   none
  • Facet by:   none
  • Test:   Two sample t-test
  • Part 1E: Statistically Grounded Challange challenge icon

    1) Enter your Player ID and Group ID into the Coffee Truck App1. Verify that you have exactly 10 samples from each location. Note that sometimes in can take the data a few hours to load, so if you do not see your data in the App, try again later. Using Sales as the response variable, conduct a two-sample t-test to determine if there is a differences in the locations.


    2) Enter your Player ID and Group ID into the Coffee Truck App1. Verify that you have exactly 10 samples from each location. Note that sometimes in can take the data a few hours to load, so if you do not see your data in the App, try again later. Using Sales as the response variable, conduct a two-sample t-test to determine if there is a differences in the locations.


    3) Compare your study results to others in the class. What percentage of your class found a p-value less than 0.05?


    4) Put Player ID on the x-axis, verify that all students in the class properly sampled 10 days at each location. If any Player ID’s do not appear to have properly followed instructions, list them here and remove them for all future questions on this page.


    5) Compare the student data in question 3. How often was the Business District mean greater than the City Park mean? Explain why confidence intervals can provide more useful information than p‐values.

    This activity was designed so that the distribution of cups sold is normally distributed with a standard deviation of 10. However, the mean for the business district is 83 cups sold while the mean for the park is 74 cups sold (assuming it is during the lunch time frame, with no music, and priced at $3 a cup).


    6) Create side-by-side boxplots of sales by location using all data with your Group ID. Do the samples collected in your class appear to fit these assumptions?


    7) When conducting a two‐sample t‐test, the p‐value is the probability of obtaining a test statistic at least as extreme as the one that was actually observed, assuming that the null hypothesis is true. Write a short paragraph to Jo giving a practical explanation of p‐values and alpha levels in the context of this study. More specifically, explain why the p‐values tended to be inconsistent even though the business district is truly better than the park.


    Explore Other Games


    Data Stories


    NYPD
    Covid-19
    Recidivism
    Brexit

    Stats Games


    Racer
    Greenhouse
    Statistically Grounded
    Psychic

    Questions?


    If you have any questions or comments, please email us at DASIL@grinnell.edu

    Dataspace is supported by the Grinnell College Innovation Fund and was developed by Grinnell College faculty and students. Copyright © 2021. All rights reserved

    This page was last updated on  November 11th  2024.