Using Graphs to Compare Race Cars
Contributors: Shonda Kuiper, DASIL, Shreyas Agrawal '24, Ginger Rowell, Rod
Sturdivant
Formula One, NASCAR, rally, and drag racing – these sports combine high-powered machines with speed and
dexterity to create literal thrill rides for the driver, techs, and audience. Video game series like Forza
and Grand Theft Auto capitalize on those electrifying experiences. But, for most of us, the mechanics behind
these cars and their capabilities remain a mystery – as do the physics behind how they are driven, the way
their tracks are designed, and so on.
Shows like Top Gear, in one of its many British or American iterations since the 1970s, have attempted to
change that for the average person. The most well-known Top Gear hosts over the years – Jeremy Clarkson,
James May, and Richard Hammond – used their hour-long program not only to show off fancy “supercars” on and
off the track, but also to discuss technical aspects of the vehicles, track conditions, and driver quirks in
everyday language. Their snarky banter, clever marketing ploys, and celebrity guest spots were intended to
draw in viewers who might be otherwise intimidated by a litany of high-tech specs. Top Gear made it possible
for the average person to better understand car mechanics.
The Greenhouse Game allows players to grow and sell crops in a virtual greenhouse. It follows the process of
planning, planting, growing, harvesting, and selling crops that farmers follow with each growing season.
While players can choose any options they like, they are more likely to earn a profit if they use
interactive graphs and statistical models to improve their strategies. Here are some key terms each player
should know:
To get a meaningful version of those tech specs, someone behind the scenes must run scenarios numerous
times, then compile and analyze the resulting data. In the case of this lab, that will be you!
To get a meaningful version of those tech specs, someone behind the scenes must run scenarios numerous
times, then compile and analyze the resulting data. In the case of this lab, that will be you!
In the game below, you will need a Player ID. This will be online, so don’t use a name that
will identify you – choose something random, but it should also be something you can easily remember. On Top
Gear, most often the driver of the test track cars was a mystery driver dressed all in white, known only by
the nickname “The Stig.” Part of the fun was guessing the identity of The Stig. If you are conducting this
lab as part of a class, your instructor will give you a Group ID (which will be identical
for every person in the class).
After entering the Player and Group IDs, start by clicking the Tutorial button. The
Tutorial will provide an opportunity for you to practice driving two different cars.
Figure 1: Enter your PlayerID and GroupID
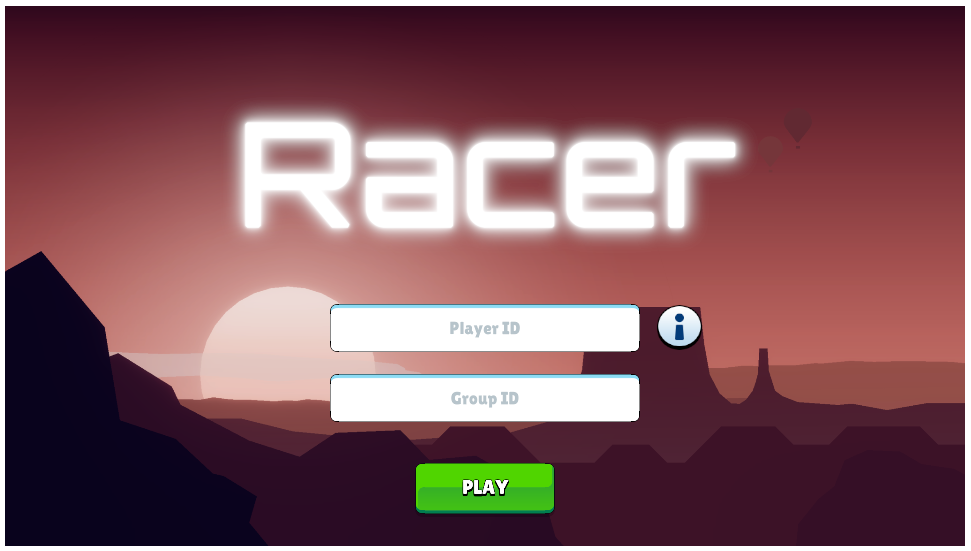
Figure 2: Select your car and customize it
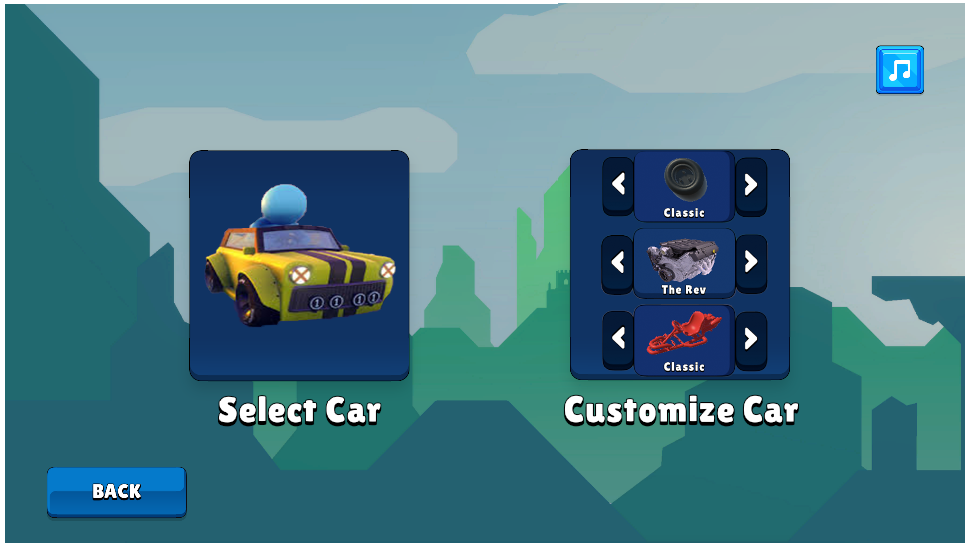
Figure 3: Choose the track
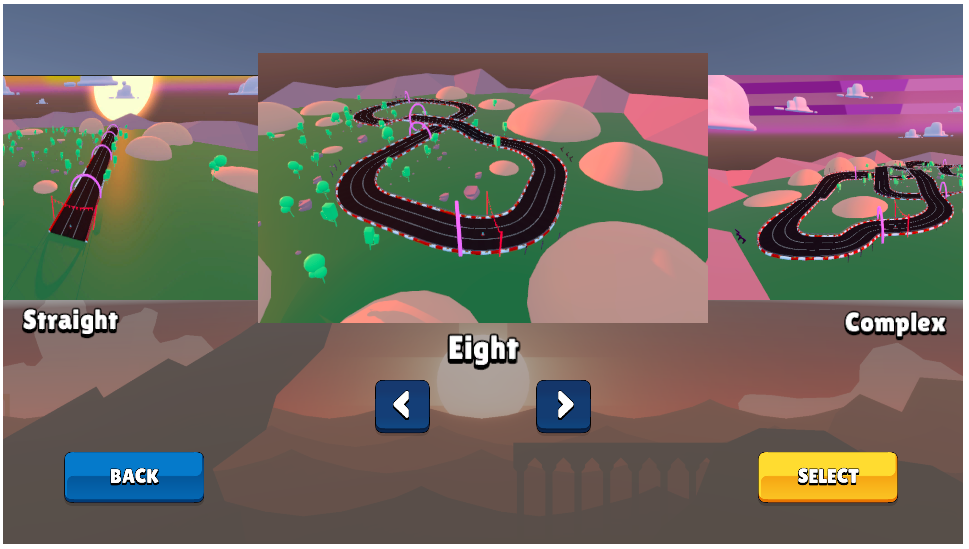
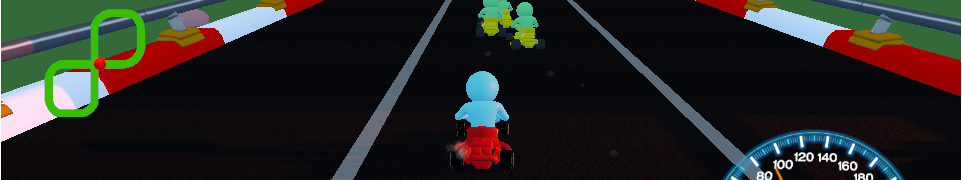
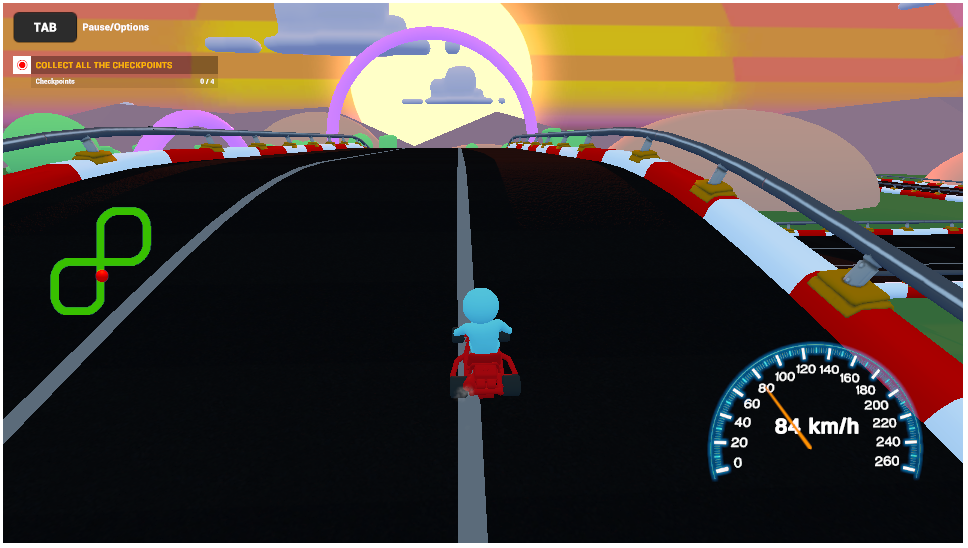
Figure 4: Race on your vehicle!
How did you do? Did you think one car performed better than the other? What data were you paying attention
to as you were racing?.
Before we analyze the data your class has collected, let’s look at a sample dataset, called sample1. In the
following visualization app, you first have the Group ID which represents a sample taken from a previous
group of players. The X Variable can either be Car, Order, or Player ID. The Y Variable can either be Finish
Time or Top Speed Reached. Try switching between different X and Y variables to see what different data pops
up. Then, complete the questions below the app to make sure you understand how this app works.
Continue to Part 2
Dataspace is supported by the Grinnell College Innovation Fund and was developed by Grinnell College faculty
and students. Copyright © 2021. All rights reserved
This page was last updated on November 11th 2024.